
This month’s ASAT feature comes to us from Shira Karpel, MEd, BCBA and Shayna Gaunt, MA, BCBA, How to ABA. To learn more about ASAT, please visit their website at www.asatonline.org. You can also sign up for ASAT’s free newsletter, Science in Autism Treatment, and like them on Facebook!
I am a first-year teacher in a self-contained classroom. I appreciate how data can guide my decision-making and help me better assess progress. Nonetheless, I feel a bit overwhelmed and would welcome some general guidance on what type of data to collect and when.
Thank you for your question. We are happy to hear you are considering data-based decision-making to best assess your students’ progress. As ABA professionals, data collection plays an essential role in making decisions and updating or revising programs based on what the data tells us. However, it is possible to be so consumed with data that it interferes with teaching. How well can a person engage and think on their feet when they are preoccupied with data collection? It can also be challenging to select the right method of data collection to accurately reflect skill progress (or lack thereof). For instance, it may look like a student is not mastering any goals, when, in fact, a different type of data collection method may tell a different story.
Data plays a very important role in the classroom for students who have Individualized Education Plans (IEP). In developing an IEP, goals should be chosen based on assessments, as well as what will be personally meaningful to the student in that setting. Data collection is a vital tool in the classroom. It is necessary to assess a student’s strengths and areas of support which will then inform potential goals. For example, data from an assessment can tell us that a student is currently able to label numbers 1-5 and based on this, we might propose a goal of labeling numbers 1-10. Think about the end goal in observable and measurable terms and then choose a type of data collection that is doable amidst a busy classroom. Then, we will be able to make data-based decisions, share objective assessments of progress and update IEPs accordingly. It all sounds nice but how can we use data without it becoming overwhelming?
We feel strongly that data should only support learning and never impede it. This is why it is important to choose a method of data collection that allows teachers to a) monitor progress, b) be present in the moment, c) engage with their students, and d) remain focused on teaching. Students will learn more from good teaching than from good data. In a classroom, this often means that you would choose methods of data collection that are manageable when teaching a large group.
Let’s review a few of our favorite data-collection methods and their potential applications in the classroom.
Frequency
Frequency refers to the number of responses within a specific period of time. In other words, how many times are you seeing the occurrence of a particular target? Tally counters are a great way to collect frequency data. They are not cumbersome! A tally counter is something you can wear on your finger or waist while you’re teaching and click the counter when you observe a behavior. Frequency is often a common measure for behavior reduction goals, for example reducing the number of times a student elopes from the classroom. Frequency data are often collected as part of toilet training efforts (e.g., successes, accidents, initiations). However, frequency is also a simple measure for a lot of skill acquisition goals. Requesting and spontaneous language are some programs where we may choose a frequency count over any other type of data collection. For example, how many times a student greeted a friend or how many times a student asked for help. There can be creative ways to keep track of frequency, most teachers I work with love to carry around a sticky note and make tallies when they can! These tallies can then get added up at the end of the day and graphed.
Duration
Duration refers to how long the behavior persists. We often take duration data when we want to know how long it takes students to complete specific tasks. We also take duration data when analyzing impeding behavior, like tantrums. How long do they persist? It’s important to include duration data for interfering behavior because it can be an important measure of progress; frequency may stay the same but duration increasing or decreasing is meaningful. Duration can also be used for skill acquisition goals like time on task or social skills.
An efficient way to track these interfering behaviors is to use partial interval recording. By dividing the observation period into smaller units of time, like 1-minute and then checking off the times that these behaviors occur, we get information about both duration and frequency. This can then be graphed so that we can see trends in behavior.
Probe Data
Probe data means that we take yes/no data on the first trial of a program and then put our pencils down and teach! Probes can also be done less often if in a classroom situation (e.g., think spelling test), or in the community. Teaching should still happen after the probe (especially if it was incorrect!). Mastery may be something like “3 correct responses across 2 different people.” For example, if a student is learning to label colors, you might mark down a “yes” or “no” for the first time each day that you ask them to name their colors. Then, continue to do lots of fun play activities with colors (but no data!). Probe data can be great for progressing students who learn quickly through programs. They may only need a few exposures of the material. For example, a probe data sheet can be used with a program like, “Expressive Labels” such that multiple targets can be run simultaneously, and the student can advance through them quickly. Caution: the downside of probe data collection is that instructors might not run as many teaching trials as they should if there are no data to record after the first response. Probe data can be easily achieved in a classroom setting as there is often a lot of teaching happening anyway throughout the day.
Trial-by-Trial Data
Taking trial-by-trial data means that we record data for each trial run and then get a percentage of correct responses. If a student is asked to label a set of 3 colors (e.g., blue, red, yellow), you can take data on each color presented (correct or incorrect) and end up with a percentage score. Mastery is usually something like, “80% or more for 2 sessions, across 2 people.” Some children need more exposure, and repetition is good for their learning. Collecting trial-by-trial data encourages instructors to run at least 10 trials. Graphing the percentage tells us more information about performance across trials than probe data. It is also more objective than rating scale data. By graphing the percentage, we can see if the curve is increasing or decreasing or if there are any other notable changes.
See the example below for one graph illustrating an increasing trend and one graph illustrating a decreasing trend. The graph with increasing data tells us that the student can label all 3 of those colors with proficiency. When a graph looks like this, we can “master” teaching those 3 colors and move to teaching another set of colors. The graph with decreasing data tells us that we need to look closer at how the colors are being taught as the student is not learning the way we are teaching. Perhaps the student has over-generalized and is answering, “Blue” for every answer, or perhaps the student is just randomly selecting a response, or just not motivated to respond. In any case, the data show us that we need to look at our teaching procedures and make changes.
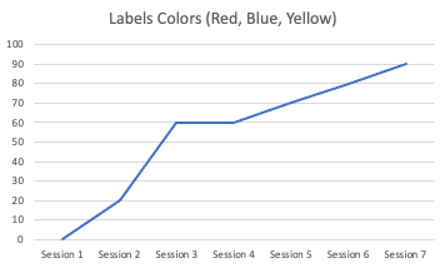 Figure 1. Graph with an increasing trend. Figure 1. Graph with an increasing trend. |  Graph with a decreasing trend. Graph with a decreasing trend. |
This is often the default measure of progress but also the most cumbersome because it means that you are also looking for every opportunity that the response could have occurred but did not. Percentage is most appropriate for testing-style goals – when working at a table and the student is clearly presented with multiple opportunities in a row. For example, after a unit on animals, the teacher presents 10 animals for the student to label. The student’s score out of 10 would be the percentage correct. This is often not ideal for many goals, so think about choosing frequency or probe instead.
Rating scale data
A rating scale describes behavior along a continuum, like a rubric. Although rating scale data can be subjective, they can describe the level of independence (or resistance) for an activity without impeding teaching. During the time when the instructor and the student are getting to know each other, relationship building and engagement (a.k.a. pairing) are first and foremost (Oliveira & Shillingsburg, 2023). A clipboard or electronic data collection may ruin the quality of that interaction. Rating scale data can outline some goals for the instructor to work on and then the child can be rated at the end of the session, based on a continuum of how well they did that day. The scores are then graphed. Check out more about rating scale data sheets and download a free copy.
A rating scale is also a great measurement tool for group-based learning in a classroom. The students can each have goals that can be accomplished in a group setting, for example “staying on task” or “raising hand.” Then, while the teacher is teaching, another staff member can record rating scale data. Rating scale data is also something that doesn’t need to be recorded in the moment; when the activity is over, the teacher can recall how the student did based on the defined scale. Rating scale data are easy for any staff member to collect without it being overwhelming.
Conclusion
Choosing a data collection method is an important part of the process but only the first step. Do not forget to then analyze and refer to the data to make data-based decisions. Include your team in reviewing the data and ask for input as to what they think might need to be changed. Refer to data when dialoguing with parents about progress, particularly if parents were part of the data collection. You want them to appreciate that data tell an important story.
As a teacher, you want to see your students make progress. Data can help you assess, plan, and monitor that progress in a way that doesn’t have to be overwhelming. When used as a tool, it will help you, parents, and the student see that progress and be able to make changes accordingly.
References
Baer, D. M., Wolf, M. M., & Risley, T. R. (1968). Some current dimensions of applied behavior analysis. Journal of Applied Behavior Analysis, 1(1), 91. https://doi.org/10.1901/jaba.1968.1-91
Burke, M. D., Vannest, K., Davis, J., Davis, C., & Parker, R. (2009). Reliability of frequent retrospective behavior ratings for elementary school students with EBD. Behavioral Disorders, 34(4), 212-222. https://doi.org/10.1177/019874290903400403
Chafouleas S. M., Christ T. J., Riley-Tillman T. C., Briesch A. M., & Chanese J. A. M. (2007). Generalizability and dependability of direct behavior ratings to assess social behavior of preschoolers. School Psychology Review, 36(1), 63-79. https://doi.org/10.1080/02796015.2007.12087952
Cooper, J. O., Heron, T. E., & Heward, W. L. (2020). Applied behavior analysis. Pearson UK.
Fiske, K., & Delmolino, L. (2012). Use of discontinuous methods of data collection in behavioral intervention: Guidelines for practitioners. Behavior Analysis in Practice, 5(2), 77-81. https://doi.org/10.1007/BF03391826
Iovannone, R., Dunlap, G., Huber, H., & Kincaid, D. (2003). Effective educational practices for students with autism spectrum disorders. Focus on Autism and Other Developmental Disabilities, 18, 150-165. https://doi.org/10.1177/10883576030180030301
Merbitz, C. T., Merbitz, N. H., & Pennypacker, H. S. (2015). On terms: Frequency and rate in applied behavior analysis. The Behavior Analyst, 39(2), 333-338. https://doi.org/10.1007/s40614-015-0048-z
Oliveira, J., & Shillingsburg, A. (2023). Clinical Corner: Building rapport with students using specific strategies to promote pairing. Science in Autism Treatment, 20(12).
Citation for this article
Karpel, S., & Gaunt, S. (2024). Clinical Corner: How do I choose the right data collection method? Science in Autism Treatment, 21(5).
About the Authors
Shira Karpel, MEd, R.B.A (Ont), BCBA is the co-founder and director of How to ABA, an online resource and community for ABA professionals. Shira has a Masters in Special Education and has been in the field of ABA since 2011, receiving her BCBA in 2014. Together with Shayna, they trained and taught many therapists, clients, and parents and collected a massive bank of ABA programs and resources. In an effort to give back to the field, Shira and Shayna decided to create How to ABA as a way of sharing our collection of resources with others. As a former teacher, her passion is in using ABA in classrooms in order to create positive and comprehensive learning environments for all students. She is the Clinical Director at a private school in Toronto and is loving getting to make a difference in the lives of children and families daily. She is passionate about making the principles of ABA practical, doable and relevant to every child in any situation
Shayna Gaunt, MA, R.B.A (Ont), BCBA is a dedicated professional in the field of Applied Behavior Analysis (ABA) and co-founder of How to ABA, an online resource and community supporting ABA professionals. With over two decades in the field, a Master’s Degree in ABA from the University of Nevada Reno, and extensive international experience, Shayna brings a vast expertise across diverse settings. She emphasizes collaborative excellence in direct therapy, supervision, and training, striving to deliver high-quality services and resources to clients and fellow ABA practitioners. Through How to ABA, Shayna aims to make ABA principles accessible and practical, fostering a community where professionals can share, learn, and grow together.